Spatial Analysis in Australia
What data best describes a location? Is it the age of the people living nearby, proximity to a train station, or maybe it’s how many trendy cafes are within a five minute walk? The explosion of geospatial data available over the past few years has opened up new avenues for businesses to understand how location impacts their operations.
This post will cover some of the ways you can use geospatial information as part of your analysis and where you can find the tools and data required to get started. The focus will be on Australian datasets, but it should be applicable anywhere where there is similar data sources available.
What types of Spatial Analysis are there?
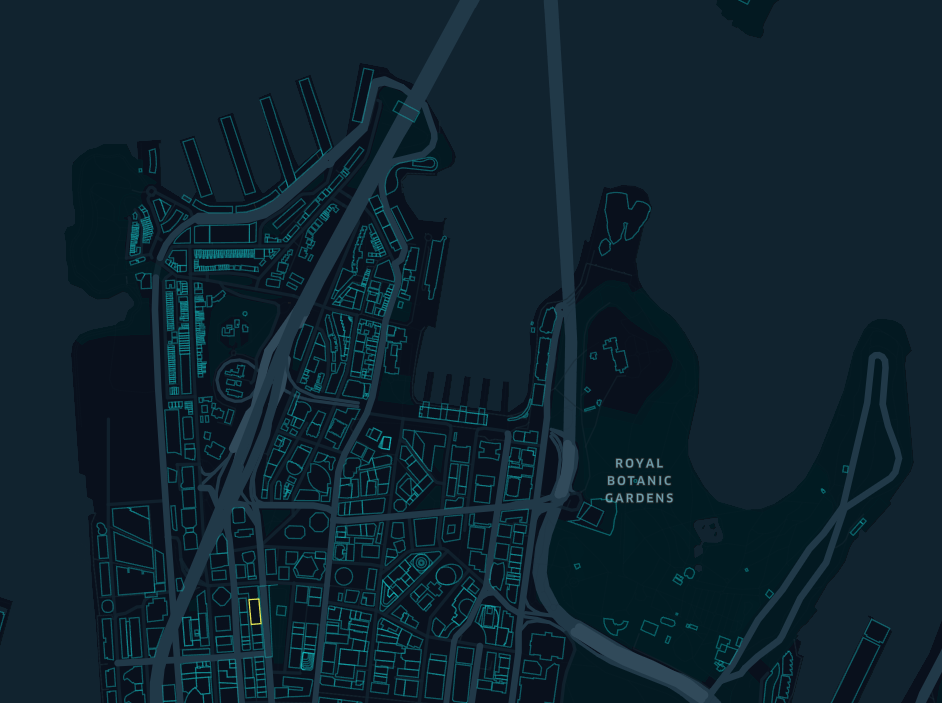
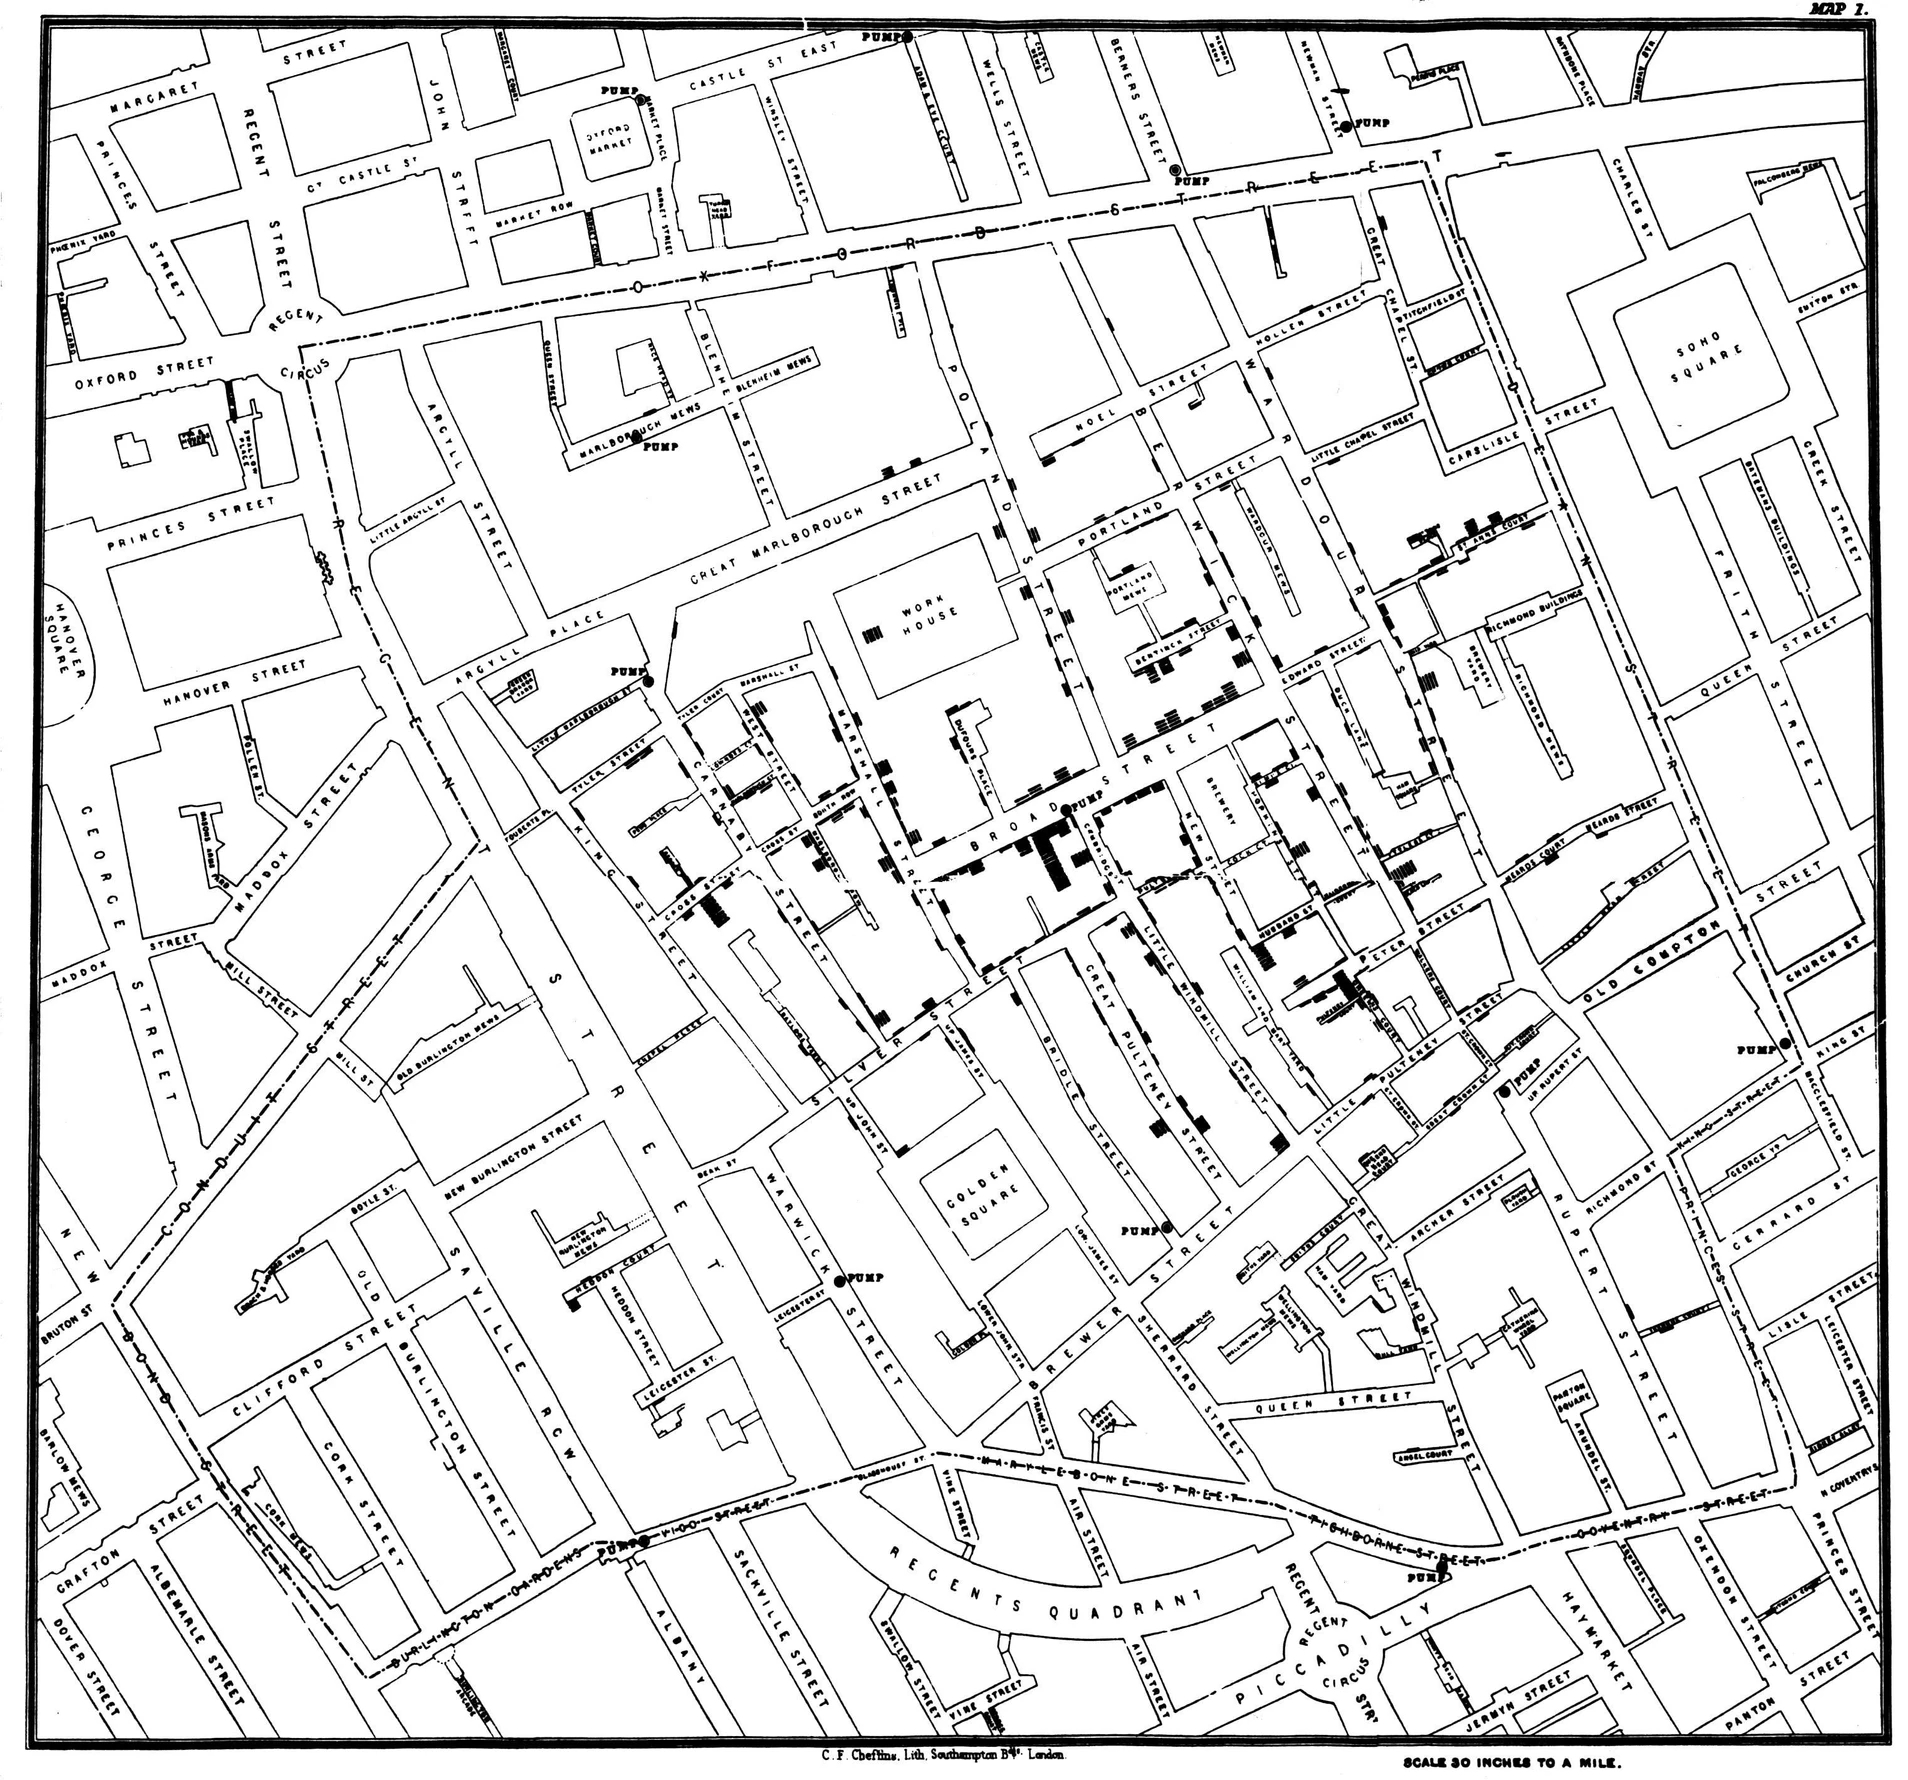
Mapping and Visualisaiton
A picture is worth 1,000 words and that seems to be especially true with mapping and spatial visualisation. Before even modelling any data it’s possible to find trends and patterns in different locations just by organising and combining different geospatial datasets. A great example of this was done by the physician John Snow in 1854, where by mapping cases of Cholera in Soho London, he was able to identify a water pump on Broad St as the probable cause of the outbreak.
GeoMarketing
Understanding your customers is important for any business and the increased availability of spatial data is allowing companies to better identify and define customer segments. Location is obviously a critical decision for any bricks and mortar retailer, by using spatial information companies can better identify what factors of a location impact sales most and then find the best locations to build new stores in next. Some of the considerations of a new location might be, distance to nearest train station, number of competitors in a 10 km radius, how many 18-25 year olds live within a 10min drive, etc. These are some of the features we can create and then measure the effect they have on the business performance.
Transportation and Logistics
One of the more interesting aspects of spatial analysis is how people will move from Point A to Point B. Will they use public transport, will they drive or will they use multiple methods of transportation? As populations increase in major cities and urban sprawl continues, the pressure that puts on existing transport infrastructure is considerable. There are innovative solutions being developed across the world to solve these issues, from some of the more Boring solutions to those in our own back yard.
Predictive Maintenance
In the same way we can use spatial information to understand what factors might affect a business we can use similar techniques to understand what might lead to equipment failures at certain locations. The equipment could be things like cell towers, water or gas pipes or power lines. Using geographic information like rock type, elevation and weather conditions along with historical performance data, companies can better plan maintenance cycles of equipment.
Where to get data?
There is a lot of great information freely available in Australia from organisations like; Australian Bureau of Statistics (with things like Census data), GeoScience Australia (ELVIS has lots of information relating to things like elevation), State Transport Authorities (most have live feeds of transport data available in a standard format like NSW Open Data) and the Australian Bureau of Meteorology.
There’s also other datasets you can obtain fairly easily such as; Open Street Maps (try using Trimble to access OSM data like roads, buildings, places of interest, etc), Amazon Web Services (they have a brilliant repository of geospatial data) and the Google Maps API (which is great for not only data but also calculating things like travel time). And if you’re in a large organisation you might consider purchasing mobility data from a telecommunications company which tracks people movement at an aggregate (non personably identifiable information) level.
What software to use?
One of the things I’ve been blown away by over the past few years is the rapid development of great open source tools for geospatial analysis. The tools I’ll use for a project are; PostGIS (for large scale data manipulation), QGIS (a nice graphical user interface for analysing spatial data), R (which has some amazing geospatial packages available, along with this book) and a recent tool by Uber called Kepler.gl which allows for some great data visualisations and exploratory analysis.
If you want to discuss geospatial analysis with us, or have any questions about the material above, feel free to continue the conversation with us on twitter. Have fun mapping!