Interpretable Machine Learning - a core skill for the competent data scientist
Machine learning interpretability is an increasingly important, and oft-neglected area. There are multiple complementary interpretability methods available to data scientists, and a working knowledge of these is critical if more powerful black-box methods are to be deployed in business settings.
Last year, at the International Conference on Machine Learning (ICML ‘17), there was a tutorial session on interpretable machine learning. At the time, I was working with a client that was having trouble making sense of the logistic regression model I had built for them. Hoping to wow my client with the latest and greatest from the cutting-edge, I attended, but was disappointed to find that I had already implemented much of what they had suggested - less-complex models, sensitivity testing, variable importance measures, etc.
Fortunately, there have been a few developments since then. But first:
Why should I care?
“We can’t just throw something out there and assume it works just because it has math in it.”
Cathy O’Neil, author, Weapons of Math Destruction

Ideally, a model should be simple enough to be understood by those who use its outputs. However, machine learning is hard. Increasingly complex models move ever further from intuitive explanations, yet decision-makers have to rely on them to compete. Interpretable models are much easier for humans to trust.
The power and potential of machine learning is well documented. If that power is coupled with understanding, it opens the door to new innovations that have disruptive potential.
Let us examine the attributes of such a model.
The problem of abstraction and interpretability
To explain abstraction let’s look at a physical model, in this instance a car. What happens when you drive a car? You apply the brakes and use the steering to move around. Do you question how the engine works? Have you even looked under the bonnet? Here you are working at the highest level of abstraction. The engine is a black box for you. Lower down the hierarchy, there is a mechanic who knows how the engine works. The mechanic knows how to repair the engine but may be unaware of how it was designed or manufactured. This is again a lower level of abstraction. For the mechanic, the design of the engine is a black box.

Now, as a driver, the engine may be a black box but you still trust the car. Why? Because the car responds to your commands in a consistent and reliable manner.
If we extent this analogy to machine learning, we indeed find that the modeller often does not have much intuition behind the internal model mechanics, and more crucially, the user does not understand the modelling process. While this is ok (as with our driver), there is a need to develop that trust before the model can be deployed with confidence.
So what needs to be considered to build that trust? Reliability and consistency certainly come into it. There are also issues of fairness, (emerging) regulatory requirements and model quality. These criteria are expanded on below:
Fairness
Ensuring predictions are unbiased and are not discriminating against protected groups (even if not explicitly). There has been a lot of press recently about discriminatory algorithms and interpretability measures go a long way to mitigating this.
Regulatory and Privacy Concerns
The General Data Protection Regulation (GDPR) mentions a “right to explanation”, which, while still being debated, does signal a desire from regulators to improve machine learning interpretability. Similarly, privacy regulations require that sensitive information in the data is protected - in some cases this can be hard to ensure without a good understanding of model drivers.
Reliability and Robustness
Reliability, in the context of machine learning, means the model should work for a wide range of inputs. Small changes in the input should not lead to big changes in the prediction. To bring back the car analogy, your trust as a driver would be quickly eroded if every now and then steering left caused your car to turn right.
Model Quality
Even when model accuracy is the only criterion (such as in hedge fund models, or Kaggle competitions), interpretability methods provide a useful feedback loop, allowing the modeller to pick up errors in the data or model itself, as well as providing a sense check on extrapolation potential.
Causality
While interpretability does not imply causality, interpretability methods provide a link between intuitive features and model outputs, as opposed to spurious correlations born from noise or unnecessary complexity.
The Status Quo - Interpretable Models
Here’s how things usually play out. An analyst or team is engaged to create a predictive model. If the business has little experience with statistical modelling, there will usually be a few iterations (with all kinds of ‘black box’ models attempted) before it is made clear to the analyst that the model needs to be explainable. More seasoned managers will state this up front. The analyst will then run a linear or logistic regression, or a decision tree. The model will take a hit on its accuracy, but oh well, at least the business can now understand it. Or can they?
Other interpretable models do exist - k-Nearest Neighbours; Naive Bayes, for example, but they still suffer from an accuracy deficit (generally) when compared with more sophisticated methods. The following graph displays this conundrum:
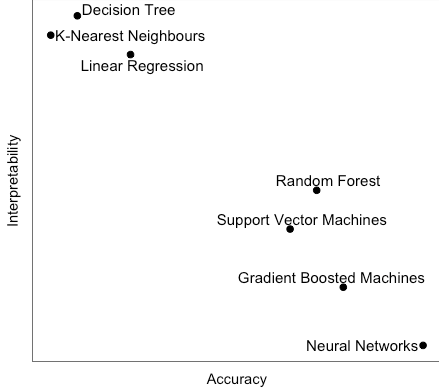
Of course, this graph is a guide only - in the real world results will vary depending on the data and the model parameters. But it is an empirical fact that as model complexity increases, interpretability suffers. Fortunately, the methods described in the next section go a long way to alleviating this condition.
Interpretability measures
In more complex models, there is rarely a monotonic relationship between the target variable and its predictors (i.e. x may not directly lead to y). However, several methods have emerged to shed light on the inner workings of even the most complicated models. The techniques described below constitute some of the most successful attempts to reveal the underlying machinery driving predictions.
Feature Importance Measures
For nonlinear, non-monotonic response functions, variable importance measures are often the only commonly available quantitative measure of the machine-learned relationships between independent variables and the dependent variable in a model.
Techniques such as LOCO (Leave-One-Covariate-Out) involve calculating the increase of the model’s prediction error after permuting each feature, and can work across any model at both a global and local level. Other techniques may be model-specific, such as the decrease in node impurity commonly used with tree-based methods (shown in chart below).
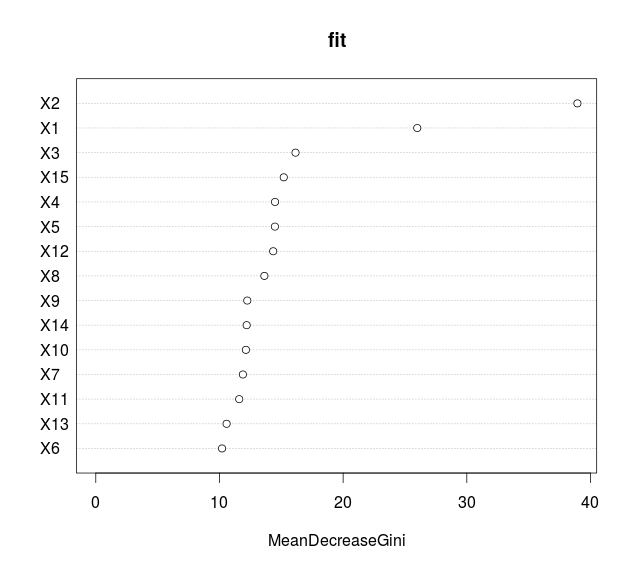 Source: Freakonometrics blog
Straightforward Sensitivity Testing
Sensitivity analysis has been widely used in various fields to test model robustness. A model’s sensitivity is defined as the magnitude of the change in its output in response to a change in its input(s). In practice, one (or more) input variable is tweaked, and the change in the prediction is captured. The size (and direction) of this change gives a useful insight into the dependence of the model on that variable.
Surrogate Models
Put simply, a less-complex (and hence more interpretable) model, such as a linear regression or decision tree, is trained on the predictions of the original model. As the important factors from these models can be more easily quantified, they can be used as a proxy for the behaviour of the more complex model. Of course, there are some major assumptions at play here, but at the very least it provides another perspective on the most key elements of a model.
It is also possible to train these surrogate models on a subset of the data, capturing the behaviour of the model at a particular locality. This is precisely the intuition behind LIME.
Partial Dependence Plots / ICE Plots
The partial dependence plot shows the marginal effect of a feature on the predicted outcome.
Partial dependence works by averaging the model output over other features, so that the remaining function shows the relationship between the feature in which we are interested, and the prediction.
Similarly, an Individual Conditional Expectations (ICE) plot visualises the dependence of the predicted response on a feature for EACH instance separately, resulting in multiple lines, compared to one line in PDP.


LIME
Local Interpretable Model-agnostic Explanations (LIME) is a variation of the surrogate model. The essential difference is that instead of global surrogate model, LIME uses a local surrogate model to explain a single prediction.
The procedure for using LIME is fairly simple. A number of datapoints are sampled from a normal distribution around the mean of the features in the training data. A point of interest is selected and the sampled points around the point of interest are given a higher weighting. An ’explainable’ (e.g. linear) model is then fit to these points, creating a decision boundary at the local level which is relatively straightforward to interpret.
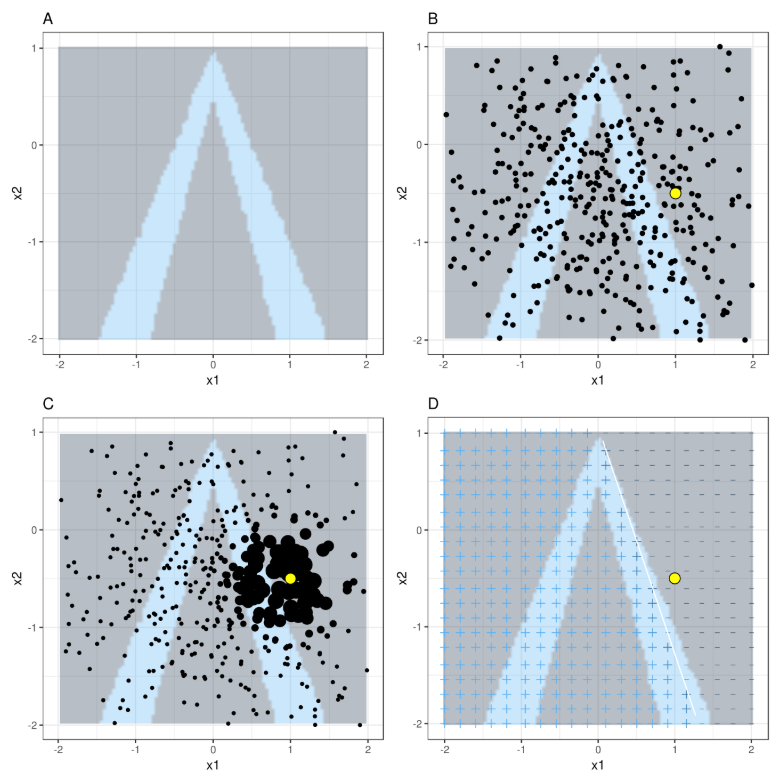 Source: Interpretable Machine Learning, Christoph Molnar (2018)
Shapley Value Explanations
Shapley Value Explanations is an approach borrowed from game theory. Imagine a game of football: each player has an effect on the outcome of the game. But not all players are identical - some will make a higher contribution towards the outcome. To quantify this, the game is played (simulated) under every possbile combination of players, and their marginal contributions to the outcome in each simulation is averaged. Therefore, the Shapley value is the average marginal contribution of the individual player. To apply this to machine learning, simply substitute “feature” for “player” in the above and compare the results.
Interestingly the Shapley value is the most mathematically rigorous of the techniques discussed here; however it is also the most computationally intensive.
Conclusion
Interpretability depends on the nature of the machine learning model. As we progress towards more complex models, interpretability becomes progressively difficult. However, there are now various ways to deal with this problem. The key thing to realise here is, as with everything in data science, there is no silver bullet. Each one of these methods has its pros and cons, and only with practice and understanding can one deploy them purposefully to truly open up the black box. Having said that, we at Verge Labs have endeavoured to make this easier by creating a utility that allows the user to input their data and model (or create a new one) and apply / explore many of these methods in a user-friendly manner. We also offer training and advisory services to provide you and your business with the expertise needed to really understand your model output. Please get in touch for more info.